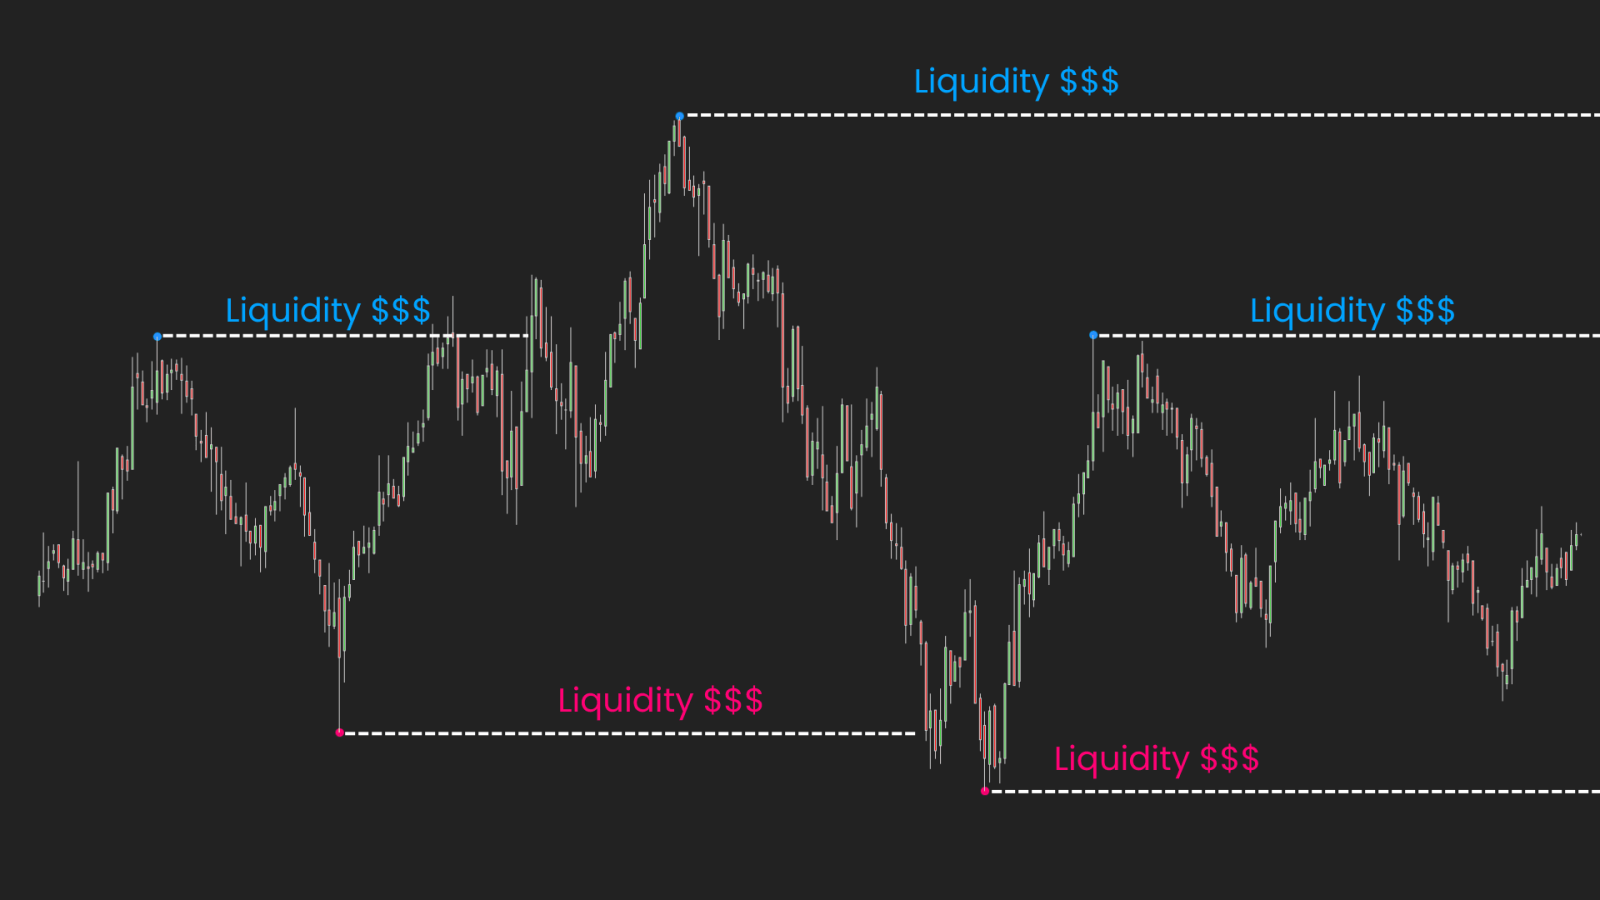
Can liquidity movement actually be tracked?
Across many high-probability ICT setups, 2 liquidity behaviors tend to appear repeatedly.
The first occurs when liquidity is taken and order flow begins to shift.
The second occurs when the market continues seeking liquidity toward a larger objective.
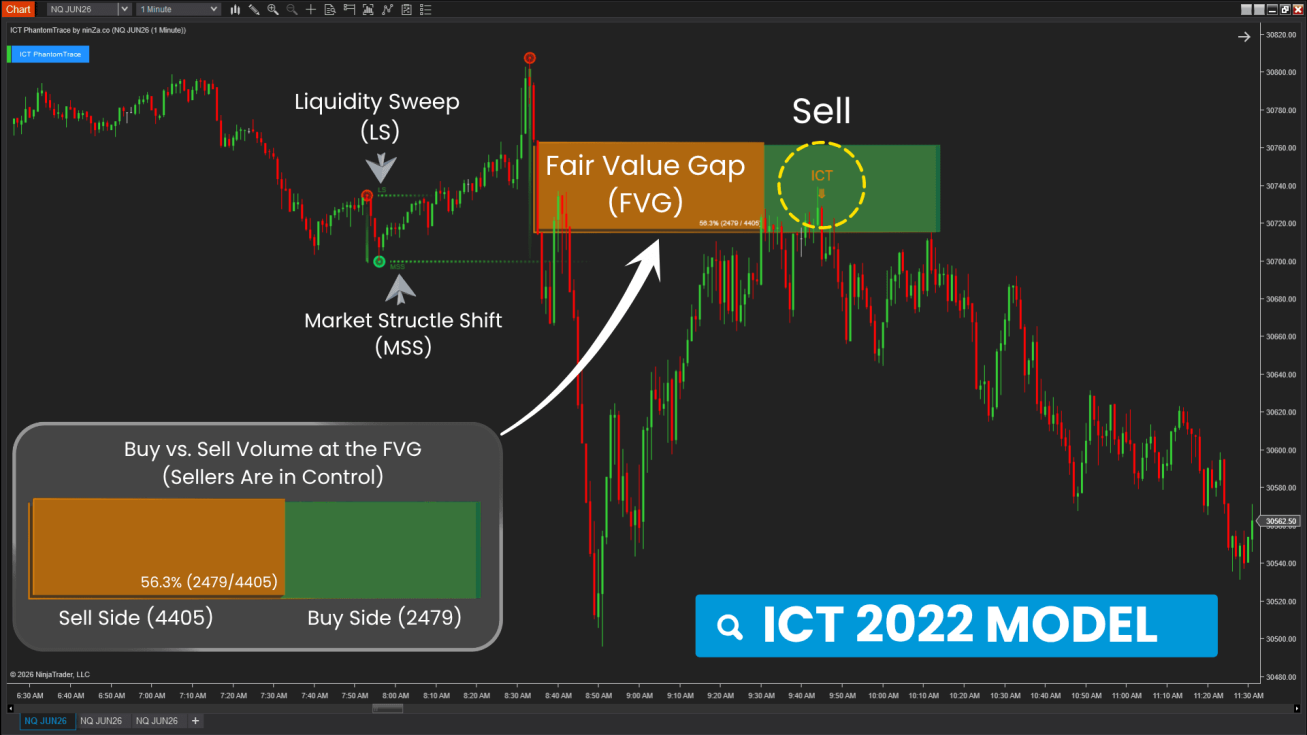
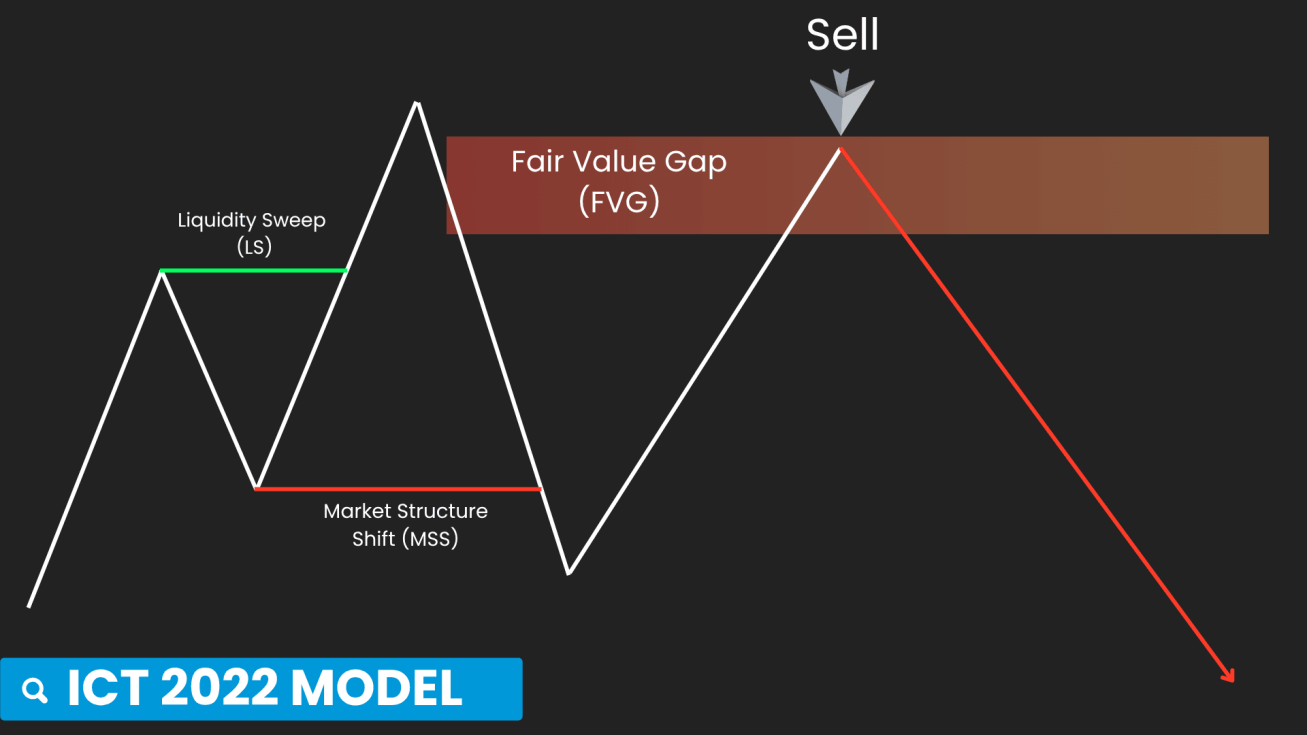
Although they can look different on the chart, both often represent important phases of market flow.
One of the ideas behind the ICT 2022 Model is that reversals rarely happen because of a single event.
Liquidity is taken first. Structure begins to lose validity. A displacement move creates an imbalance. Price later revisits that imbalance before continuing in the new direction.
Rather than viewing a reversal as a single trigger, the model treats it as a process of liquidity transition.
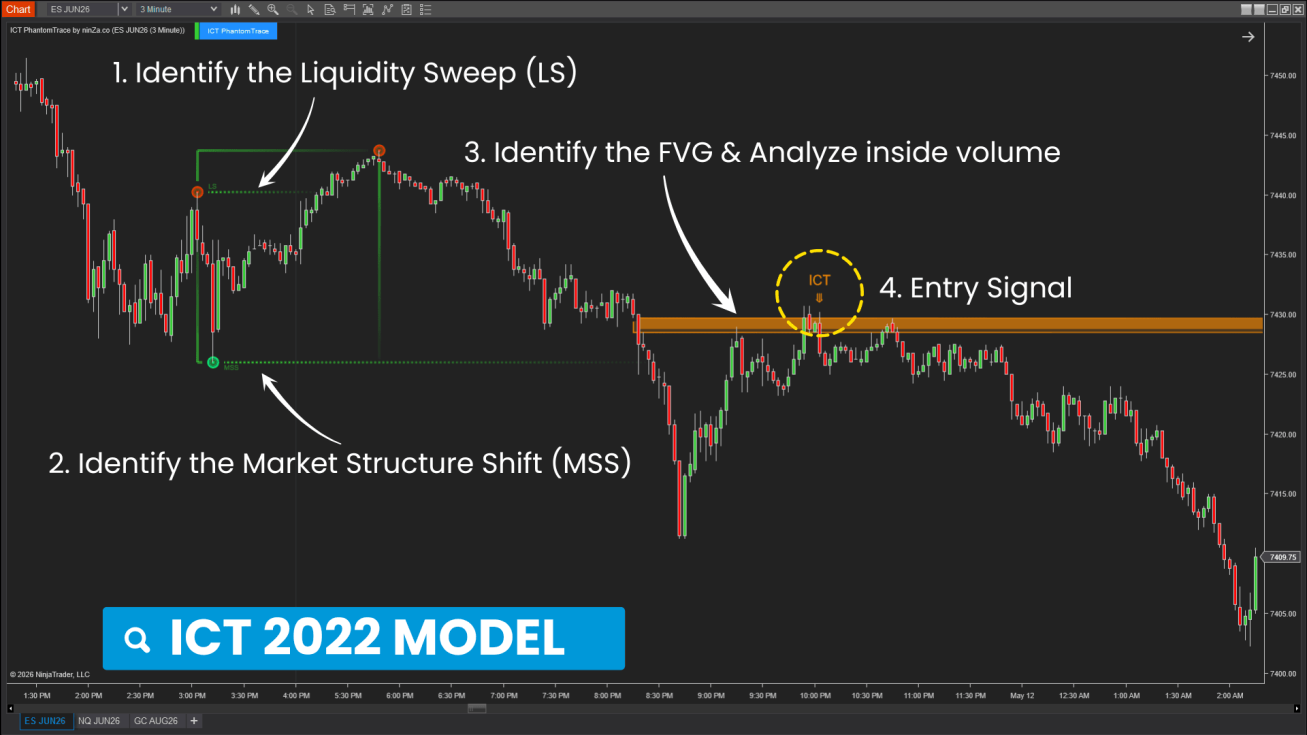
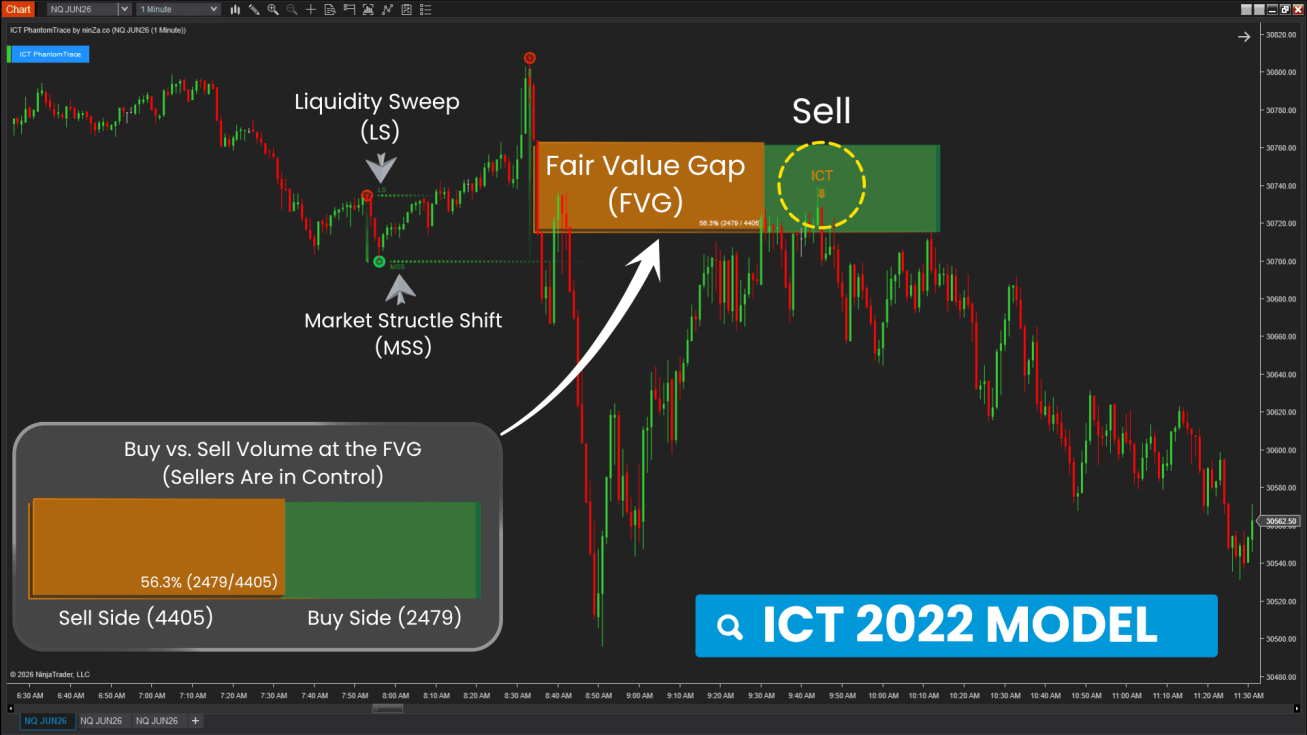
Understanding that process can provide additional context when evaluating potential reversals by connecting liquidity, structure, and imbalance within a single framework.
Learn more here → https://ninza.co/new/ict-phantomtrace-lp?utm_source=social&utm_medium=forum&utm_campaign=ict-phantomtrace-lp